Tag Archives: cpu

Install ESXi 8 on Intel 12th CPU – “Fatal CPU mismatch on feature”

This problem is caused by the new architecture of Intel CPUs which are equipped with different types of cores – Performance-cores and Efficient-cores.

The parameter needs to be set prior to installation and the first boot of ESXi.

  1. When ESXi installation starts, press SHIFT+O to edit boot options.
  2. Append cpuUniformityHardCheckPanic=FALSE
  3. Press ENTER
  4. Install ESXi
  5. When the installation is finished, reboot the system and press SHIFT+O to edit the boot options again.
  6. Append cpuUniformityHardCheckPanic=FALSE and press ENTER
  7. To make the kernel option permanent, run the following command on your ESXi host:
    # esxcli system settings kernel set -s cpuUniformityHardCheckPanic -v FALSE
    
  8. We also have to enable kernel option ignoreMsrFaults to prevent PSOD during VM startups.
    # esxcli system settings kernel set -s ignoreMsrFaults -v TRUE

This setting allows ESXi to work with different P-Cores and E-Cores
Citrix Netscaler VPX high CPU usage? almost 100%

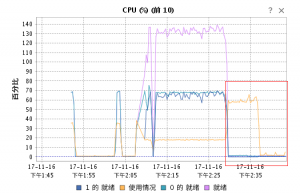
I’m running a Citrix Netscaler VPX in my lab, and I just noticed that even though there is no connection, the CPU usage for this VPX is 100%.

You can change this behavior by doing the following:

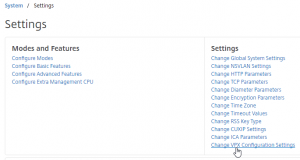
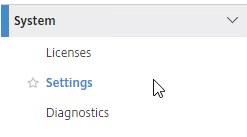
On the left, go to System > Settings.

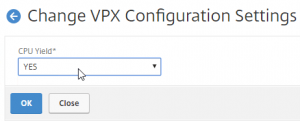
On the right, in the bottom of the second column, click Change VPX Configuration Settings.

Change the CPU Yield drop-down to YES, and click OK.

After making this change, you can see an immediate drop-off in CPU consumption.

Understanding Citrix Performance Issues

Bottleneck: provisioning services. Customers note there is excessive Network I/O and CPU utilization.
Bottleneck: vDisk fragmentation or server virtual instances. Customer notes there is excessive page file utilization and disk I/O.
Bottleneck: delays mounting new vDisks. Check for excessive Network and Disk I/O on delivery controllers.
Bottleneck: delivery controllers. Check for excessive historical CPU utilization.
Bottleneck: slow application enumeration. Check for excessive disk and network I/O on the data collectors.
Bottleneck: slow session creation noted within the director console: Check for historical CPU and Memoyr consumption, consider adding VCPU and memory when/where needed.
Bottleneck: higher than expected user logons. Check for high CPU and/or network utilization (not historical but may trend at random intervals). Add processing or new delivery controller if necessary to handle the expected loads.
Bottleneck: issues with local host cache (LHC). Disk and Page File I/O in excess can cause unanticipated issues with LHC. Alert and adjust when/where needed.
Bottleneck: Processor intensive apps. Check questionable servers for larger disk I/O and page file utilization. Consider adding more VCPU’s and/or memory to offset the demand on disk and page file.
Bottleneck: vDisk and/or Provisioning Services. Check for higher than normal CPU and/or Memory consumption as a deficiency will slow down the loading of vDisks and caching via Provisioning Services (PVS).
Bottleneck: Web interface authentication. Consider adding more memory and looking at network utilization trends. It may be necessary to either add more memory or to add an additional WI to your GSLB URL.
Bottleneck: slow PXE and vDisk. Check for memory and/or network utilization and consider addresssing depending on noted trends.
Bottleneck: target device latency. Check CPU and network I/O for spikes and/or trending issues.